Vision health disparities affect millions of individuals across diverse demographic groups, with factors such as race, income level, geographic location, and disability status all influencing access to care and treatment outcomes.
This article provides a comprehensive statistical overview of these disparities, highlighting recent trends and examining the systemic barriers that perpetuate unequal vision care.
Below is a broader look at the scope of vision health in the United States and why examining these data is crucial. Vision impairments, when unaddressed, can cause long-term consequences for education, employment, and overall well-being.
Examining such disparities not only clarifies the extent of the problem but also identifies which populations are most vulnerable and how policy interventions and community-based programs can help bridge gaps.
Key Statistics at a Glance
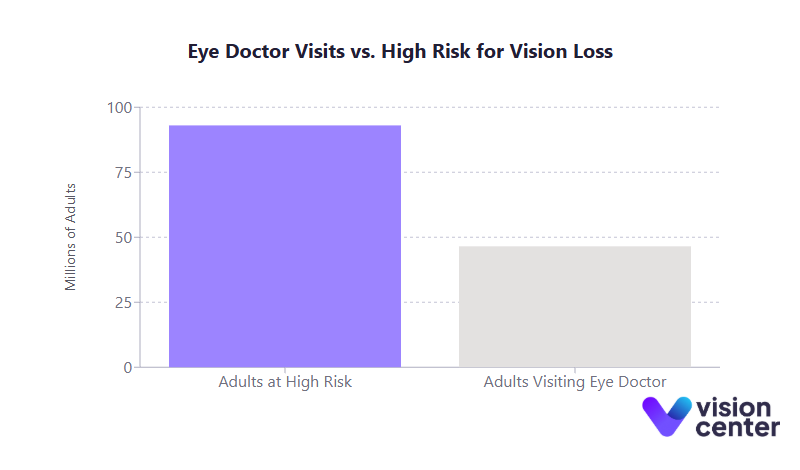
- High-Risk Adults Visiting Eye Doctors: An estimated 93 million adults in the U.S. are at high risk for serious vision loss, yet only about half of them visit an eye doctor in a given year.
- Geographic Concentration of Severe Vision Loss: Around 77% of counties in the top quartile for severe vision loss prevalence (≥4.2% of residents) are in the rural South, underscoring pronounced regional inequalities.
- Glaucoma Disparities: Black Americans develop glaucoma at 3 to 4 times the rate of white Americans and often present with the disease at younger ages, leading to more severe disease progression.
- Affording Eyeglasses: Low-income adults are more than twice as likely to be unable to afford needed eyeglasses compared to those with higher incomes (about 14% vs. 6%, respectively).
Access Patterns
Understanding who has access to timely, affordable vision care is critical for reducing preventable sight loss. Access to vision services varies widely by income level, geographic region, and whether an individual has health or vision insurance.
- Demographic Access Disparities
- Over the past decade, people with lower income and lower educational attainment have been significantly less likely to receive regular eye exams. In one national survey, individuals below the poverty line and those without a high school diploma consistently visited eye care providers at lower rates than their higher-income, better-educated counterparts.
- Racial and ethnic groups also show distinct disparities: among non-Hispanic white adults, more than half reported an annual eye doctor visit, whereas Hispanic adults had considerably lower rates.
- Age is another factor: fewer than 15% of preschool-aged children receive a professional eye exam, and fewer than 22% undergo vision screenings, missing key opportunities for early detection of vision problems.
- Geographic and Disability Factors
- Rural and high-poverty areas often lack sufficient eye care providers, with many rural counties having no ophthalmologist at all. Counties with the highest prevalence of severe vision loss disproportionately cluster in the rural South.
- Adults with serious vision impairment report additional hurdles, including lower insurance coverage rates, more frequent transportation barriers, and, in some cases, denial of services. A notable proportion also indicate unmet medical needs due to cost, more than double the rate of those without visual impairment.
- Insurance Coverage Effects
- Many individuals either do not have any vision coverage or have insurance that excludes routine exams and corrective lenses. Original Medicare, for instance, does not cover routine vision refractions or eyeglasses, leaving many older adults without coverage for basic visual needs.
- Research shows that adding Medicaid adult vision benefits can significantly boost exam rates and reduce cost-related unmet needs for glasses. When Medicaid programs provide vision coverage, enrollees are notably more likely to receive routine eye care and less likely to skip purchasing corrective lenses.
- Provider Availability
- Even in areas with some providers, patients may only have access to an optometrist and not an ophthalmologist, or vice versa, limiting treatment options for complex eye conditions.
- Distribution patterns show an urban-suburban concentration of eye doctors, leaving rural residents with fewer options and longer travel distances. Telehealth programs (such as tele-retina screening) help, but coverage remains uneven, particularly for specialized needs.
Below is a table highlighting several demographic and geographic data points related to access disparities:
| Disparity Comparison | Metric (Most Recent Data) | Group A vs. Group B |
|---|---|---|
| Race/Ethnicity – Eye Exam Usage | Annual eye doctor visit rate | White: ~52% vs. Hispanic: ~37% |
| Income Level – Affording Glasses | Unable to afford needed eyeglasses | Low-income: ~14% vs. High-income: ~6% |
| Disability Status – Cost Barriers | Unmet medical need due to cost | Vision-impaired: ~29% vs. No impairment: ~13% |
| Geography – Severe Vision Loss Prevalence | Counties in top quartile (≥4.2% severe vision loss) | Rural South: ~77% vs. Northeast: ~0.3% |
These patterns underline how socioeconomic status, disability, and geographic location can converge to form persistent barriers to vision care.
Outcome Disparities
Outcome disparities frequently mirror the gaps in access. Groups with lower access to preventive services and treatments often end up with higher incidences of advanced eye disease and worse prognoses.
- Health Outcome Variations
- Black and Hispanic Americans have higher rates of diabetic retinopathy and glaucoma yet receive less timely treatment compared to white Americans. Many do not receive annual dilated eye exams, leading to more advanced diseases at diagnosis.
- African Americans are more likely to develop glaucoma at younger ages and undergo glaucoma surgery at higher rates, often facing greater surgical risk due to late presentation.
- Although age-related macular degeneration (AMD) is more prevalent among white Americans, minority patients with AMD often present later and with poorer visual acuity, signaling a delay in detection and treatment.
- Treatment Success and Quality of Care
- Cataract surgery rates are lower among Black, Hispanic, and rural patients despite similar or higher prevalence of cataracts. When they do receive surgery, these patients are more likely to have advanced cataracts, potentially leading to complications and poorer outcomes.
- Patients with certain disabilities, including intellectual or developmental disabilities, also face higher complication risks post-cataract surgery, in part due to the challenges of perioperative care and potentially limited provider experience with special-needs populations.
- Vision Rehabilitation and Long-Term Outcomes
- Vision loss is among the top causes of disability in the U.S., with around 7 million Americans reporting vision impairment. Uncorrected vision problems can set off a cascade of negative consequences, including educational setbacks and increased unemployment.
- Children who do not receive corrective lenses early often struggle academically, while older adults with untreated cataracts or diabetic eye disease have higher rates of falls and are more likely to lose independence.
In short, untreated or poorly managed vision conditions add to broader inequities in education, employment, and overall quality of life, illustrating the fundamental importance of early detection and sustained, high-quality care.
Intervention Effectiveness
Several initiatives have emerged in recent years, aiming to mitigate these disparities by expanding coverage, increasing service availability, and creating targeted community programs.
- Policy Interventions (Federal/State)
- The Affordable Care Act’s inclusion of pediatric vision care as an Essential Health Benefit has helped millions of children gain coverage for exams and glasses. States that expanded Medicaid also saw modest increases in adult vision care utilization, particularly in programs that included dedicated vision benefits for low-income enrollees.
- Approximately 45 states require some form of vision screening for school-aged children. However, the success of such policies relies heavily on follow-up care; simply identifying an issue does not ensure children receive exams, corrective lenses, or treatment.
- Targeted Programs
- Community-based programs, such as mobile eye clinics for schoolchildren in low-income districts, have demonstrated that removing cost and transportation barriers dramatically increases the use of vision services. One program found about half of those screened needed corrective lenses, highlighting high rates of previously unmet needs.
- Some telehealth initiatives, especially for diabetic retinopathy screenings, have yielded higher exam rates in underserved regions. The Indian Health Service’s tele-ophthalmology program, for instance, has screened tens of thousands of Native American patients who otherwise lacked convenient access to eye specialists.
- Quality Improvement Efforts
- Several Federally Qualified Health Centers (FQHCs) now integrate vision services on-site to reduce the friction of referral. In these clinics, patients with diabetes are more likely to receive regular exams, improving early detection of complications like retinopathy.
- Patient navigation programs also show promise in ensuring that older adults and low-income patients complete essential procedures, such as cataract surgery.
Despite partial successes, vision health disparities remain substantial. Sustaining and expanding proven interventions, coupled with broader insurance coverage reforms, could help close many of these gaps.
Systemic Barriers
Addressing vision health disparities requires grappling with structural factors that go beyond clinical settings, ranging from insurance design to social determinants of health.
- Financial Barriers
- Routine eye care and prescription eyewear can be costly, especially for families without sufficient vision coverage. Many plans treat vision services as add-ons, and Original Medicare excludes routine refractions and basic glasses.
- Surveys show that out-of-pocket costs can be a significant deterrent, with exams often costing $100 to $200 and corrective lenses costing several hundred dollars. Consequently, low-income individuals frequently forgo eye care or delay it, leading to worse long-term outcomes.
- Healthcare System Barriers
- The separation of “medical” and “vision” insurance results in fragmented care. For example, a patient might be covered for laser treatments but not for routine refractions needed to maintain daily visual function.
- Rural communities often lack accessible facilities. Even in urban areas, patients may encounter transportation challenges, long wait times, or clinics that lack up-to-date diagnostic tools.
- Implicit bias and language barriers can also diminish quality of care. Certain ethnic and racial groups have less awareness of asymptomatic conditions like glaucoma or diabetic retinopathy, partly due to inadequate health education outreach.
- Structural and Social Determinants
- Poverty, limited education, and social marginalization all amplify the risk of vision loss and reduce the likelihood of obtaining prompt eye care.
- Racial residential segregation leads to neighborhoods with fewer healthcare providers, fewer transportation options, and overall reduced access to comprehensive medical services.
- Disability discrimination in clinical settings remains a challenge. Many offices are not fully accessible to patients with mobility or cognitive impairments, contributing to lower rates of preventive care and later-stage disease diagnosis.
Addressing these systemic barriers demands a multifaceted approach. Efforts must expand beyond traditional healthcare interventions to include policies that reduce poverty, improve insurance coverage, and proactively invest in underserved communities.
Only then can the nation move toward genuine vision health equity, ensuring every individual has the opportunity to maintain healthy eyesight.
Final Summary
Over the last decade, data consistently show that vision health is inextricably linked to broader socioeconomic and structural factors. Access to timely eye care, the affordability of corrective lenses, and well-designed public health programs can make the difference between preventable sight loss and preserved vision. Yet gaps persist, and they fall disproportionately on those already disadvantaged by race, income, geographic isolation, or disability.
Looking ahead, these statistics illuminate where additional focus is needed. Expanding Medicaid adult vision benefits in more states, integrating more low-cost or free vision care services in community settings, and improving telehealth access for rural and remote areas could all help reduce these disparities.
At the same time, fostering a broader understanding of eye health through culturally and linguistically appropriate education ensures that individuals across all demographic groups recognize the importance of preventive vision care. In doing so, policymakers, health systems, and communities can advance toward a future where all Americans have equitable access to the vision services they need.
Vision health data emphasize a fundamental truth: healthy eyesight underpins success in school, workplace productivity, and the quality of life for older adults. Reducing disparities in vision care not only saves sight but also alleviates the socioeconomic burdens that accompany preventable blindness or visual impairment. Improved insurance coverage, enhanced provider availability, and concerted outreach efforts are proven strategies, and they offer a roadmap for continued progress in tackling vision health inequities nationwide.